GBP/USD Price Analysis: Pauses after breaking weekly support trendline
- GBP/USD awaits fresh impulse to extend the short-term support line break.
- 50% Fibonacci retracement, 200-bar SMA offers the key resistance.
- 1.2945 seems to be on the sellers’ radar.
GBP/USD seesaws near 1.3000 during Tuesday’s Asian session. The pair recently broke an ascending trend line stretched since February 10 but is resting on 38.2% Fibonacci retracement level of its declines from January 31 to February 10.
However, normal RSI conditions and sustained trading below the support-turned-resistance keep sellers hopeful.
In doing so, early-February highs near 1.2945 and 1.2900 will be on their radars whereas the monthly low near 1.2875 could please then afterward.
On the contrary, pair’s pullback beyond the support-turned-resistance, near 1.3020 now, needs to cross the key 1.3040 confluence including 200-bar SMA and 50% Fibonacci retracement to take aim at the key 1.3070 resistance.
Should prices remain strong beyond 1.3070, 1.3120 and 1.3210 will be on the bulls’ radars.
GBP/USD four-hour chart
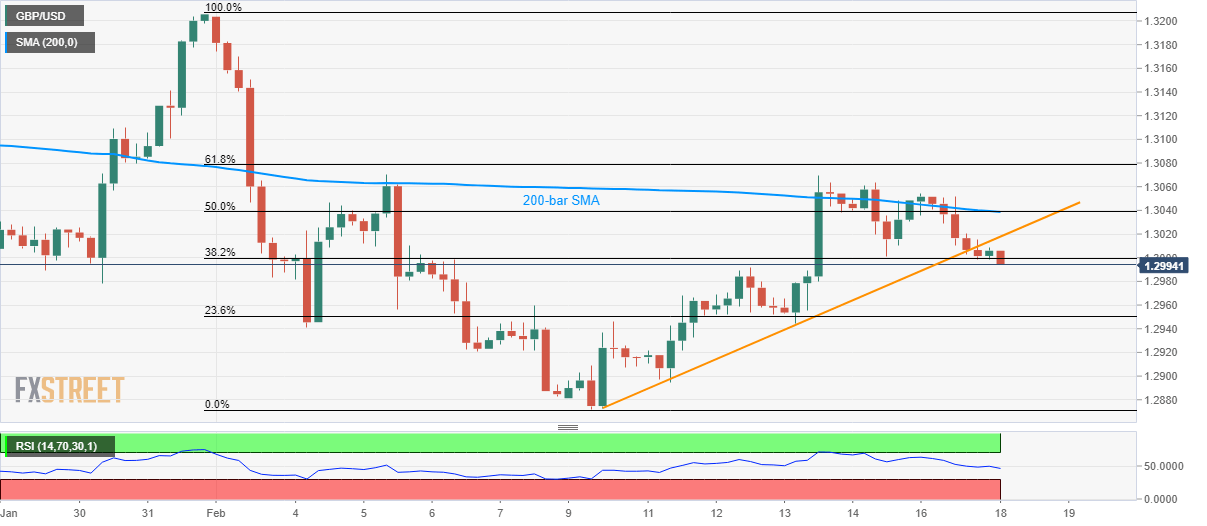
Trend: Bearish