Back
9 Jan 2020
USD/CAD Price Analysis: Greenback bounces from 26-month lows vs. CAD
- USD/CAD comes back to life after reversing up from levels not seen since October 2018.
- The level to beat for bulls is the 1.3094 resistance.
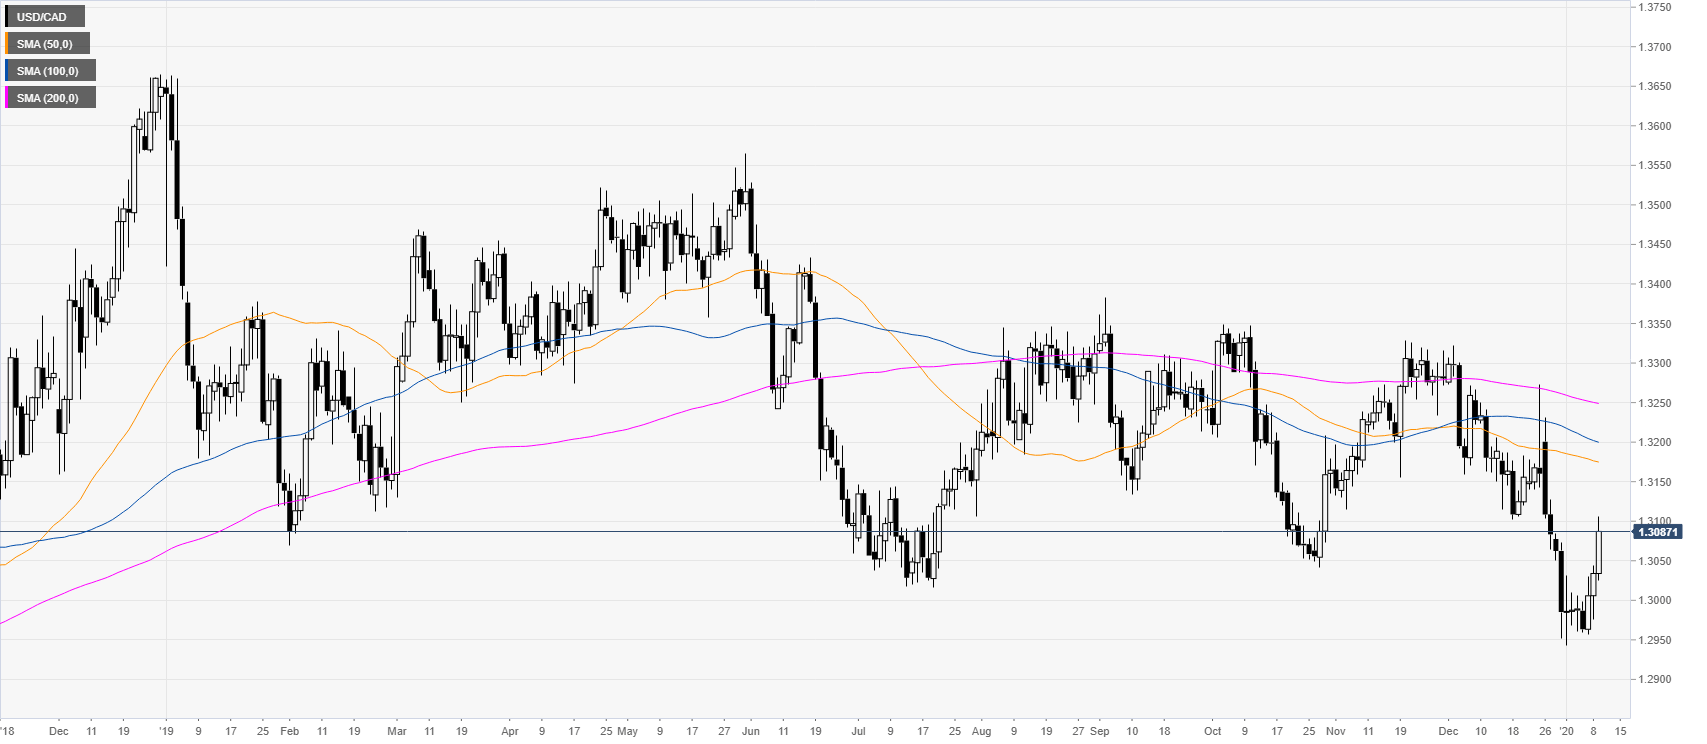
USD/CAD daily chart
The market is reversing up sharply after reaching levels not seen since October 2018. However, USD/CAD trades below its main SMAs, which suggest an underlying bearish bias.
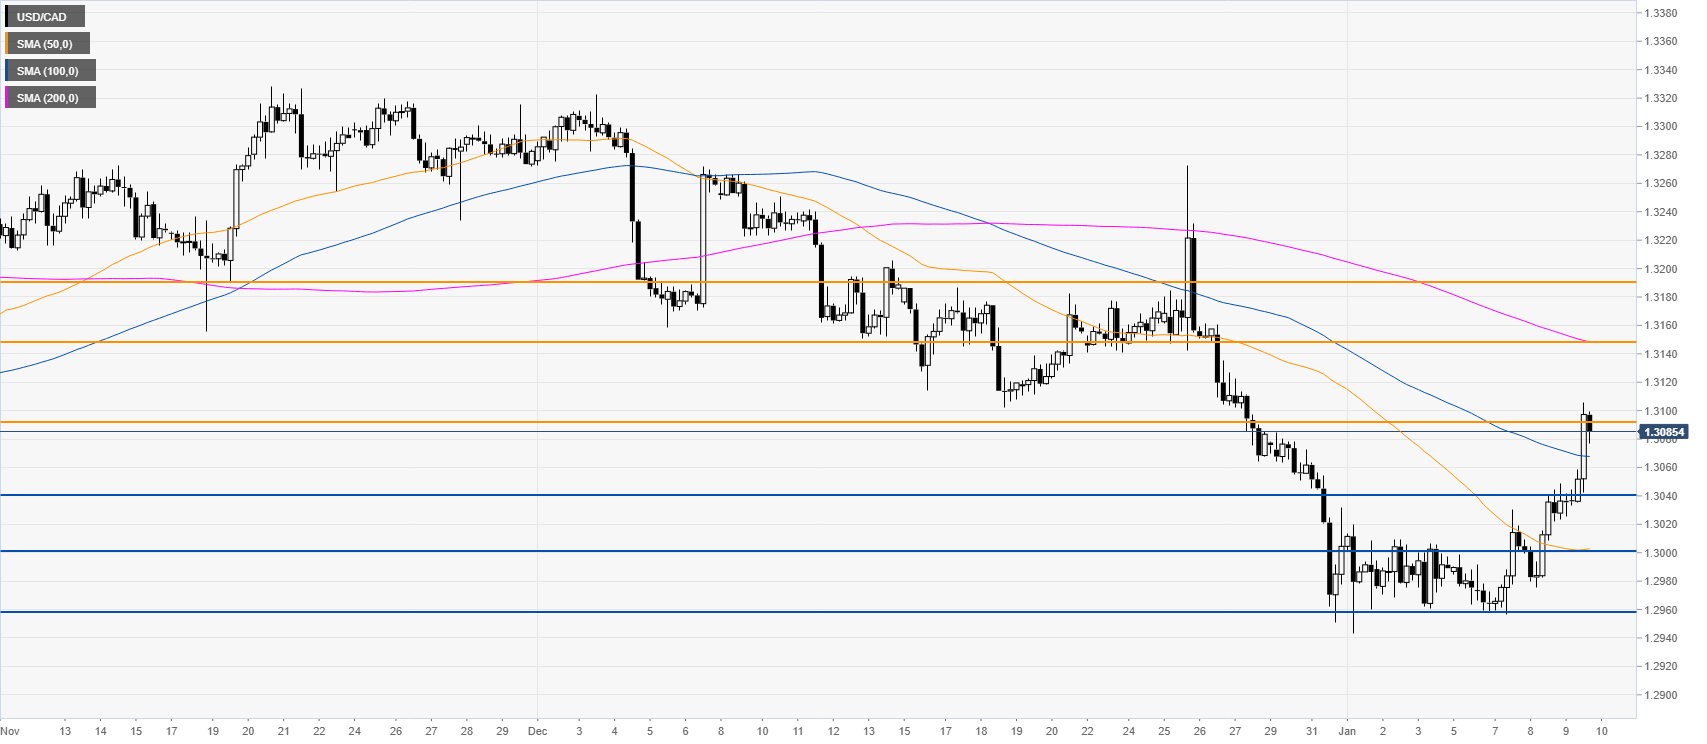
USD/CAD four-hour chart
The market decided to create a reversal up above the 1.3000 handle and is now challenging the 1.3094 resistance. As the market is quite overextended it is possible that it enters a correction in the 1.3040/1.3094 range. However, the bias seems to be tilted to the upside with ultimately a break above the 1.3094 resistance and a run towards the 1.3148 and 1.3189 levels, according to the Technical Confluences Indicator. Support is seen at the 1.3000 and 1.2960 levels.
Additional key levels