A simple stochastic-based strategy to trade in a flat market
This strategy will teach you to trade in a flat market using one of the most common indicators.
Timeframe: H4 chart for candlestick analysis, M15 chart for trading
Currency pairs: all
Market state: flat
Required indicators:
- Stochastic (14, 3, 3)
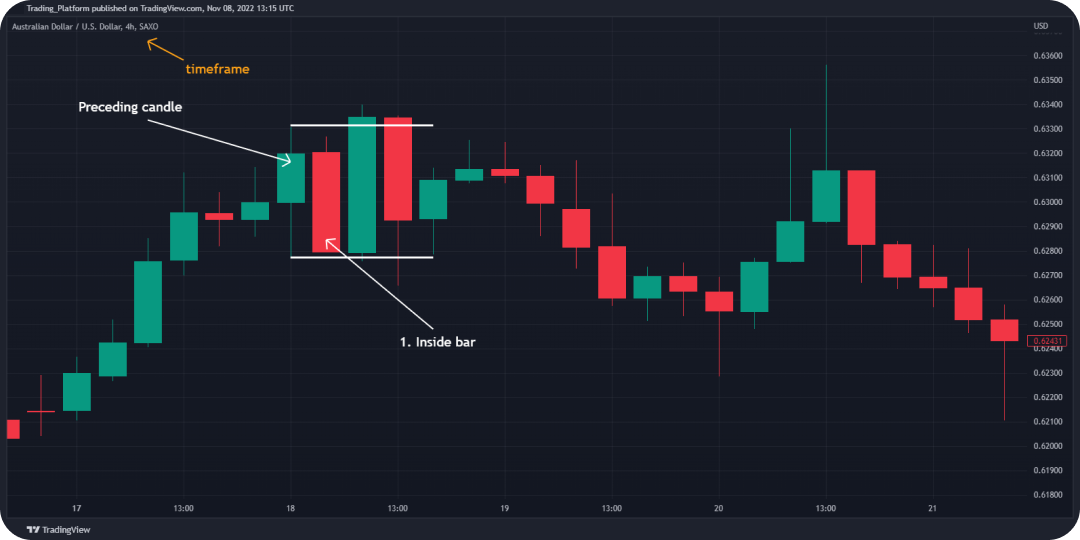
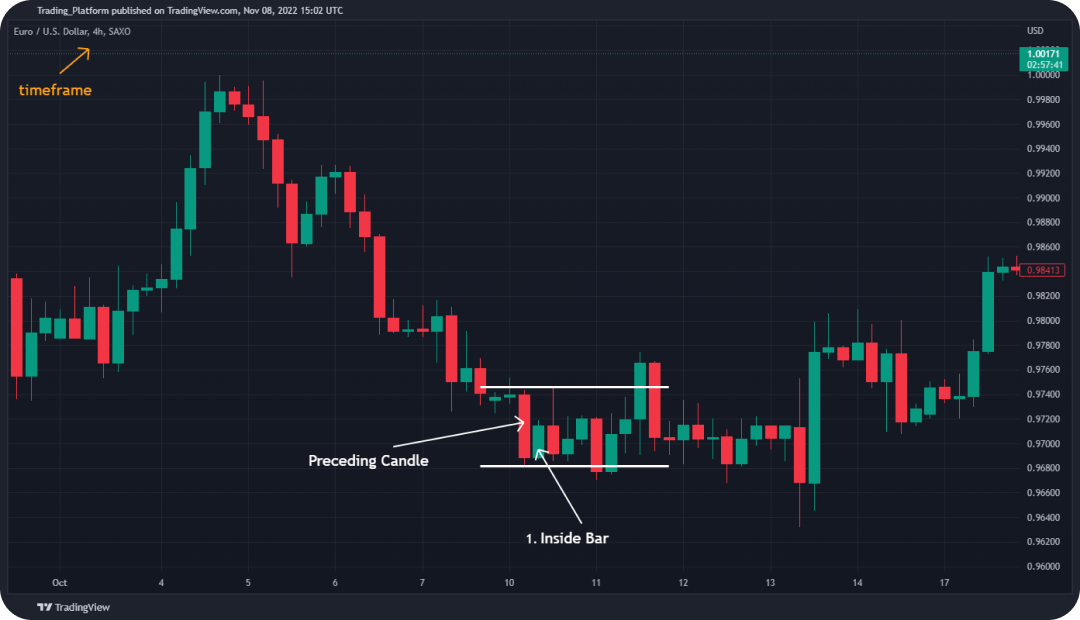
- An inside bar of a H4 chart (price action pattern: a candle which closed inside the range of previous candlesticks)
Entry steps for a short position (Sell):
1. Look for an inside bar on a H4 timeframe and mark its borders.
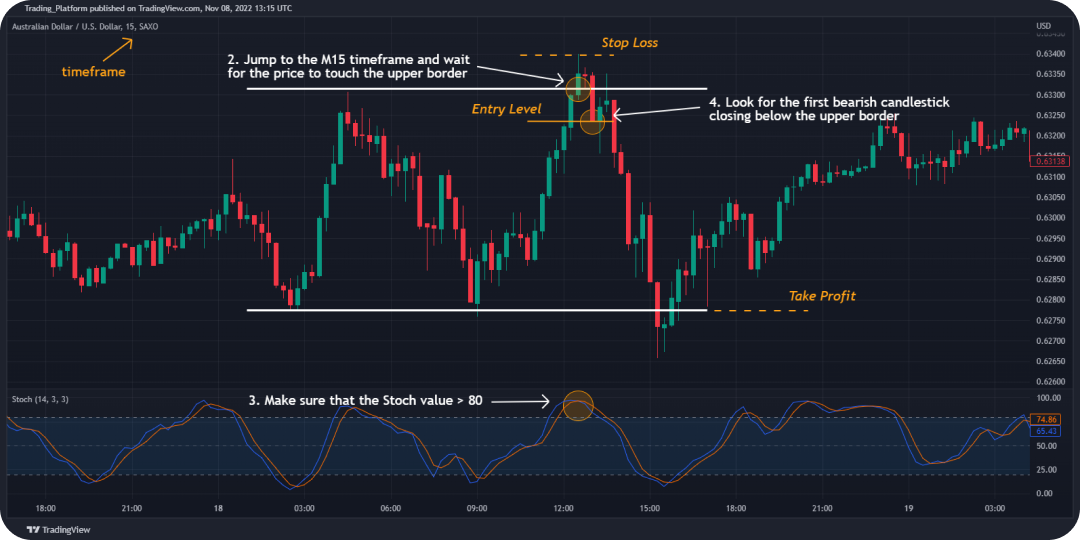
2. Jump to the M15 timeframe and wait for the price to touch the upper border.
3. Make sure that the stochastic's value is greater than 80.
4. Look for the first bearish candlestick closing below the upper border.
Stop Loss
Place a Stop Loss above the previous swing high.
Take Profit
Take your profit when risk to reward ratio reaches 1:2 or when the price touches the opposite border.


Entry steps for a long position (Buy):
1. Look for an inside bar on H4 timeframe and mark its borders.
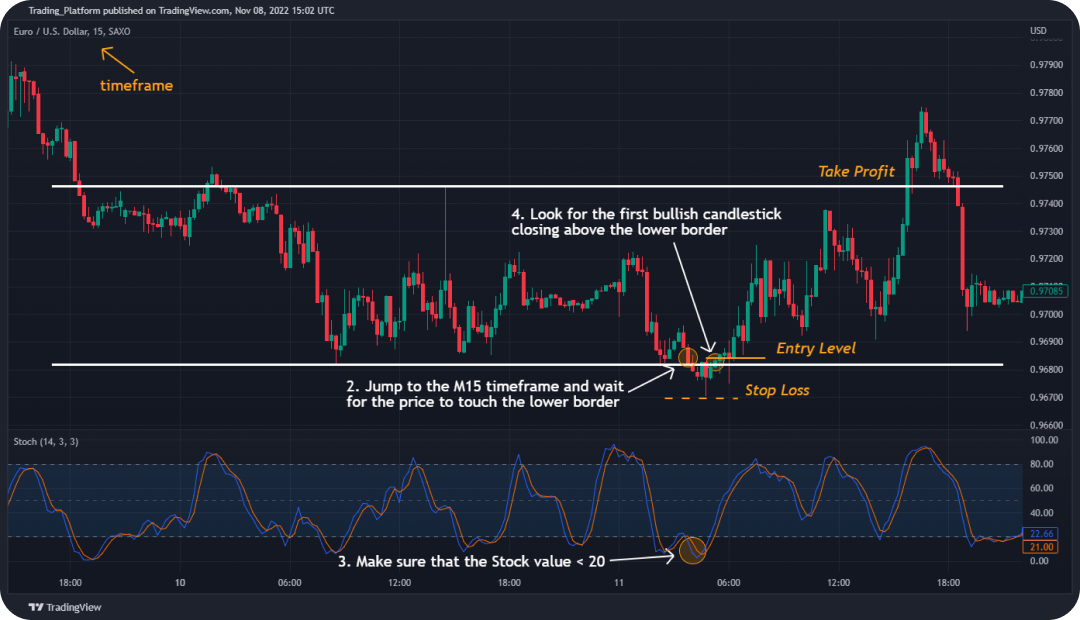
2. Jump to the M15 timeframe and wait for the price to touch the lower border.
3. Make sure that the stochastic's value is less than 20.
4. Look for the first bullish candlestick closing above the lower border.
Stop Loss
Place a Stop Loss below the previous swing low.
Take Profit
Take your profit when the risk to reward ratio reaches 1:2 or when the price touches the opposite borderline.


Download indicators settings to your desktop platform
If you're looking for a quick method to apply the indicators from this strategy, click on the button below. Read detailed instructions here.
