Differences between technical analysis and fundamental analysis
Assumptions of technical analysis
Pros and cons of technical analysis
Technical analysis is a price forecasting method involving pattern recognition on a chart. Analysts employ various tools to identify support and resistance levels, breakouts and breakdowns, trends, and trading ranges. Knowing the basics of technical analysis, one will likely be able to implement some of its crucial elements into a self-designed strategy.
Technical analysis is a method for tracking the changes in an asset's price over time. By examining past price movements, it allows traders to select the best moments to buy or sell. Here are the essential elements of technical analysis:What is technical analysis?
Category Fundamental analysis Technical analysis Focus Fundamental analysis focuses on things like how many goods and services a country produces (GDP), how many people have jobs (employment figures), and how fast the prices are going up (inflation). It also considers what the government and central banks are doing and any big news or events happening worldwide. Technical analysis uses charts to see how currency pairs' prices have moved over time. It looks for repeating patterns, like shapes or trends, that can help predict where prices might go next. Purpose Based on the above factors, the main idea is to determine if a currency is too expensive (overvalued) or too cheap (undervalued). The primary goal is to predict where the price will go in the future based on what it has done in the past. It doesn't focus on why the price changes, just that it does. Short to medium-term view Traders who think long-term use this type of analysis. Economic changes don't happen overnight; they take time, often months or years. This method is often used by traders who want to make quick trades, usually over a few minutes, hours or, in some cases, days. They care more about short-term price movements than long-term economic factors. Example If traders think that a country's economy is getting stronger, they might buy that country's currency now because they believe it will be worth more in the future. Technical analysts use special tools and patterns, like Head and Shoulders (a specific shape on a chart) or Moving Averages (that smooth out price changes), to decide when to buy or sell a currency. Read more about fundamental analysis in this article: ‘Fundamental Analysis and Economic Indicators’.Differences between technical analysis and fundamental analysis
The key assumptions in technical analysis include: Everything is in the price. Technical analysts believe that all essential information about an asset is already reflected in its price and trading volume (how much it's being traded). So, instead of worrying about news or company fundamentals, they look at the numbers and charts. Prices follow trends. Traders think that prices usually move in patterns, like going up, down, or staying the same. They aim to spot these trends and make trades that align with them. History repeats itself. People believe that past events can help predict what might happen next. They try to predict future prices by looking at past price movements and patterns. Emotions matter. Technical analysts think that feelings like fear and excitement affect how people buy and sell. These emotions can create patterns in the market that they can use to their advantage. The market reacts quickly. Traders believe the market generally responds quickly to new information, so prices change fast based on what people know. All these beliefs help traders use various tools and techniques to find good times to buy or sell currencies in the market.Assumptions of technical analysis
Professional analysts often use a mix of different research methods, not just looking at price charts like ordinary traders do. They combine various ways to understand the market better. Technical analysis can be used for any asset that has a history of being bought and sold. It's especially popular in fast-moving markets, like Forex (foreign exchange), where people trade different currencies. The main idea behind technical analysis is to predict how the price of an asset will change based on how much of it is available (supply) and how many people want to buy it (demand). Some think of it as figuring out how these forces show up in price changes. While most focus is on price changes, some analysts also look at other numbers. For example, in the stock market they may consider how many shares are being traded or how many contracts are open. This extra information helps them better predict where prices might go next. Below, we will consider the key instruments of technical analysis. A chart is a graphic representation of how the price changes within the set timeframe. In almost any trading platform, you will find candlestick, bar and line chart types. All three are based on the same data but displayed in different ways.How to use technical analysis
Charts

Note, however, that all of the charts described above show the Bid price only, and you should not rely on them to identify where the Ask price was at any given time.
Timeframes
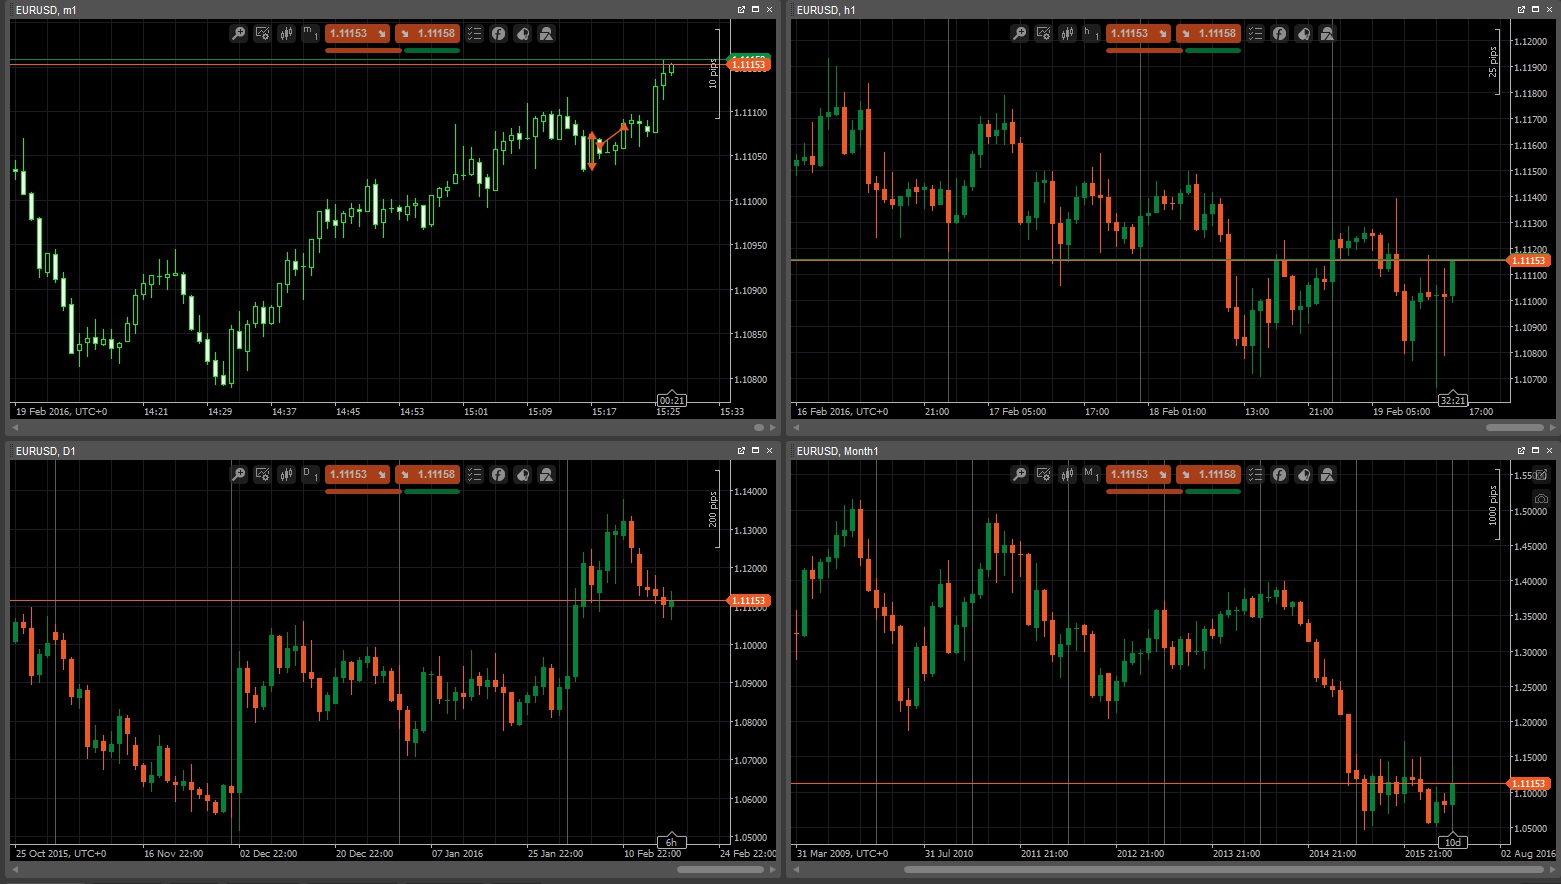
A timeframe denotes the amount of time it takes to complete each candlestick or bar and how much data it includes. For example, the H1 timeframe shows how much the Bid price fluctuated within an hour. You can customise the timeframe for each chart in your trading platform.
In general, shorter timeframes are believed to produce more signals. However, a significant part of them tends to be false. In contrast, longer timeframes may provide relatively fewer signals, but they will be stronger and more significant for a particular trend.
Here is how the same price data looks when you change periodicity:
Trend
Identifying the trend or direction in which the market moves is one of the basic techniques of technical analysis. Occasionally, it can be determined by simply looking at the chart. Other cases will require a more profound analysis of the price data.
There are two major types of market trends:
- Uptrend—a series of escalating highs and lows;
- Downtrend—a series of lower highs and lower lows on the chart.
A lack of any particular direction is referred to as a sideways or horizontal trend.
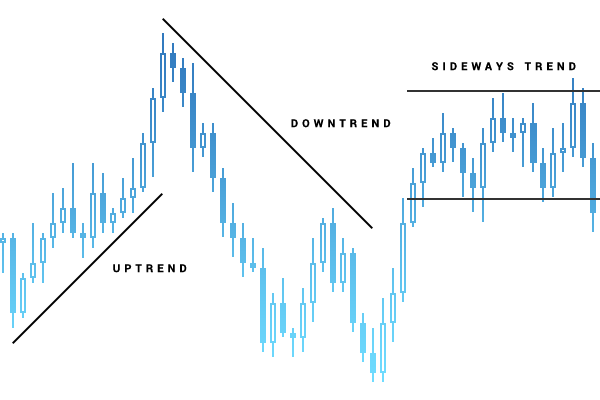
To identify a trend, you can simply draw a straight line in the direction of the price movement on a chart. Trend lines are available in almost every trading platform and may be considered one of the beginner-friendly technical analysis tools. Another option is a technical indicator that can determine and display a trend when added to a chart.
Support and resistance
Finding support and resistance levels allows one to determine when and in which direction a position should be opened and what the potential profit or loss may be. Support is the price level at which an asset has difficulty going below, and resistance denotes the level at which the pair has difficulty rising above. These levels, however, do not always hold, and breakouts or breakdowns occasionally occur in one direction or another.
Support and resistance levels form a trading range—a horizontal corridor that contains price fluctuations within a timeframe.
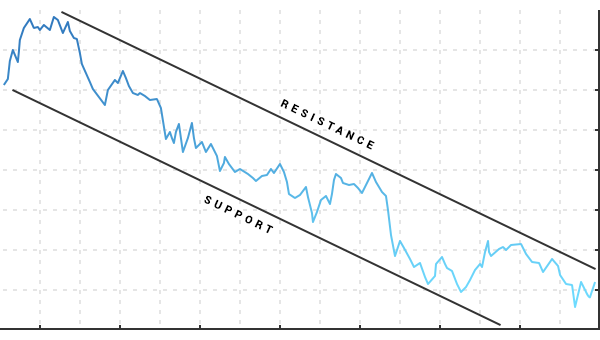
A price movement through the identified level of resistance is referred to as breakout. Its bearish counterpart is called breakdown—a price movement through the identified level of support. Both breakout and breakdown are usually followed by an increase in volatility.
To identify support and resistance, you can simply mark the levels where the price had difficulty rising above and falling below in the past. Various technical indicators (i.e. Fibonacci or Pivot Points) can determine and draw the levels on the chart automatically.
Chart patterns
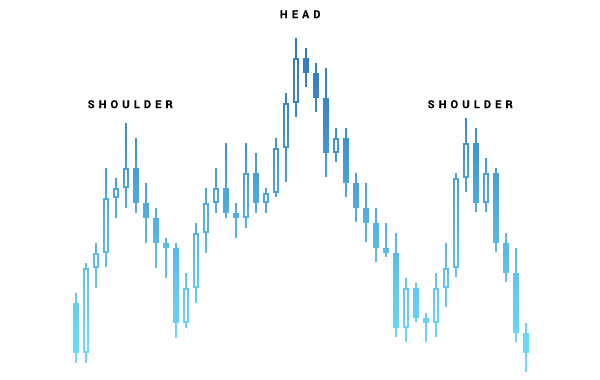
A chart pattern is a distinct formation that predicts future price movement or creates a buy or sell signal. The theory behind it is based on the assumption that certain patterns observed previously indicate where the price is currently headed.
- Head and Shoulders is considered to be one of the most reliable chart patterns, which signifies that the trend is about to change. There are two types of this pattern—Head and Shoulders Top, which shows that upward movement may soon end and Head and Shoulders Bottom, which means that the downtrend is about to reverse.
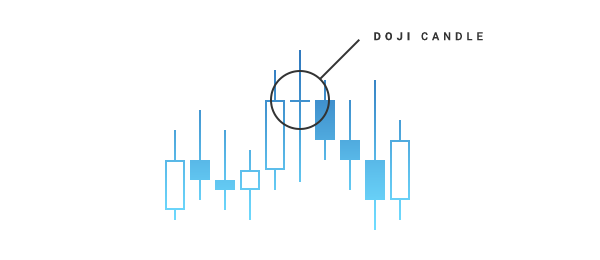
- A Doji is a candlestick with a short body (which means that the candlestick opened and closed at almost the same price) and relatively long wicks on each side that show market volatility during a timeframe. Doji usually signifies market indecision since neither a bullish nor bearish trend prevails.
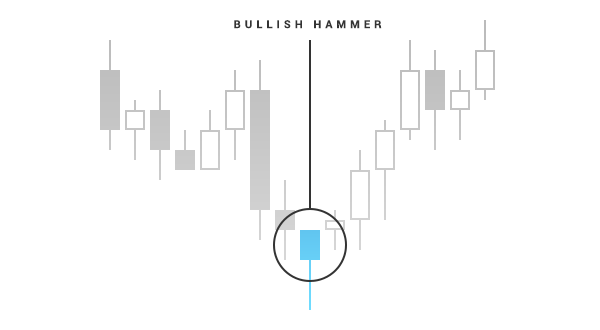
- Bullish Hammer is a candlestick that usually occurs at a turn of a downtrend. This candlestick must have wicks twice as long as the body.
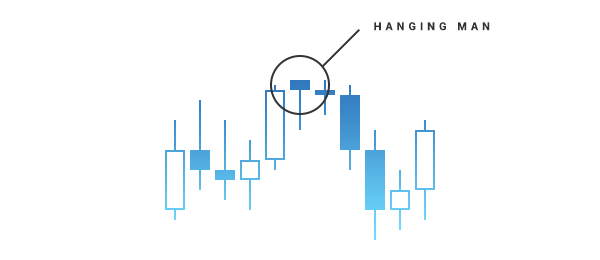
- Hanging man is the bearish counterpart of the bullish Hammer that has a shorter body and long wicks and is usually found before the reversal of the uptrend.
- Another popular chart pattern is the triangle. There are three types of triangles: symmetrical, ascending and descending. The symmetrical triangle is a pattern where two trend lines meet at one point, and neither of them is flat. This pattern usually confirms the direction of the current trend. In an ascending triangle, the upper trendline is flat, and the lower one is headed upwards. This pattern is considered to be bullish and may predict a breakout. The descending triangle has a flat lower line, and the upper trendline is descending. It is a bearish pattern, signifying an upcoming breakdown.
Indicators
One of the tools that allows to predict or confirm trends, patterns, support and resistance levels or buy and sell signals is a technical indicator. It is a software developed specifically for your trading platform that makes calculations based on price movements and volatility. Both OctaTrader and MT4 or MT5 have a wide range of readily available indicators, however, you can always download a custom one or even create it yourself.
Simply adding an indicator to a price chart may greatly extend your understanding of the current market situation and help you decide in which direction you should be trading. For instance, indicators such as Fibonacci or Pivot Points may come in handy to identify support and resistance levels. Momentum indicators will help you to measure the rate of price change and Zig Zag can be used to predict when the trend will be more likely to reverse.
To learn more about how indicators can be installed and customised, please check the instructions for MT4 or MT5 in our Manuals section.
Here are the advantages of technical analysis: Market trend analysis. Technical analysis helps traders understand how the market moves by looking at past prices and trading volumes. They can spot trends, like when prices go up (uptrend) or down (downtrend). If prices start changing direction, that's called a reversal. Reliable indicators. Special tools in technical analysis, like Moving Averages and RSI (Relative Strength Index), help traders figure out when to buy or sell. For example, if the MACD shows a crossover, it might mean it's time to make a trade. Entry and exit points. This method allows traders to find good times to jump into a trend or to exit when they've made a profit. They look for certain price levels where they think the trend will change, like breaking through a resistance level. Diverse analytical choices. Technical analysis offers many tools so traders can pick what works best for them. Some prefer quick trades using shorter timeframes, while others prefer to look at longer-term trends. Target setting and risk management. Traders can limit how much they are willing to lose (stop-loss levels) and decide when to take profits. This helps them manage risk and know when to exit a trade. Understanding market psychology. This analysis also looks at how emotions like fear and greed can affect prices. For instance, if prices rise fast, it might mean people are getting greedy, which could lead to a drop soon after. Early signal detection. By closely watching price trends, traders can spot changes before most people do. If they see signs that a trend will change, they can jump in early and potentially make more money. The downsides of technical analysis are the following: Ignoring economic and political factors. Technical analysis in Forex focuses mainly on price and volume data, overlooking critical economic and political events that can influence currency values. For instance, a currency might look undervalued on the charts, but unexpected news like an interest rate change or political instability could cause its price to fall further, regardless of technical signals. Different interpretations of the same patterns. Analysts can interpret charts differently, which can be confusing. One might think a pattern means to buy, while another thinks it means to sell. It's essential to get multiple opinions instead of just trusting one person. Slow reactions. Technical indicators often rely on past data, so they can be slow to show when trends are changing. When you see a signal to buy or sell, the best opportunity might already be gone. For instance, some indicators might tell you to act too late, causing you to miss out or even lose money. False signals. Sometimes, technical analysis gives signals that don't turn out to be true. A pattern might suggest a price will go up, but then it goes down instead. It can be frustrating for traders who have followed the signals. Subjective interpretations. Since technical analysis relies on patterns and charts, different analysts can come to different conclusions about what's happening in the market. What looks like a good buying opportunity to one person might look like a bad idea to another. The past doesn't always predict the future. Just because a trend worked in the past, it doesn't mean it will work again. Markets change constantly, so relying too much on historical patterns can be risky. What worked years ago might not apply today.Pros and cons of technical analysis
Final thoughts


